|
|
|
The current NINES Comment will always be found at the bottom of this page.
DRESSED TO THE NINES, 17 September 1999
For over three years I have followed the work of Tom Byron on the internet and elsewhere. Since I am am an Elliott Wave and Long Wave devotee, I was initially somewhat dubious about the guy with the nine wave system. As a long time coastal Californian I was well aware of the "ninth wave", which is the "destroyer wave" from the sea that washes innocent bystanders off the rocks to their doom. But except for serial Elliott moves in which wave three subdivides twice, nine waves made little sense to me in price terms.
Nevertheless Byron persisted in sending me updates of his system, and I gradually found myself wondering how the Ninth Wave was playing out during long quiet periods from Byron.
Without going into the philosophy and technicals of doing it--at this point--let me just show you his basic system in the SPX and XAU, my and his favorite indexes.
The monthly XAU chart shows the basic approach. Byron's theory is that prices move through matched phases of nine waves up and nine waves down. These waves are defined in terms of momentum or, practically, the slow stochastic oscillator, and in terms of time.
The price and the stochastic chart show these waves clearly. The long term cycles show the lows in 1986, 1992 and possibly in 1999, in time and in price.
The weekly SPX chart shows much the same pattern. An upwards nine wave cycle alternates with a down cycle
The bottom line is that Byron currently sees a possibility of a low in the XAU (and gold) coming up, in price and time. At the same time, he sees a last wave up (8th) forming now in a down cycle for SPX.
Hopefully I will get Tom Byron to share with us more of this fascinating system, and the ideas behind it. He's convinced me!
1 October 1999
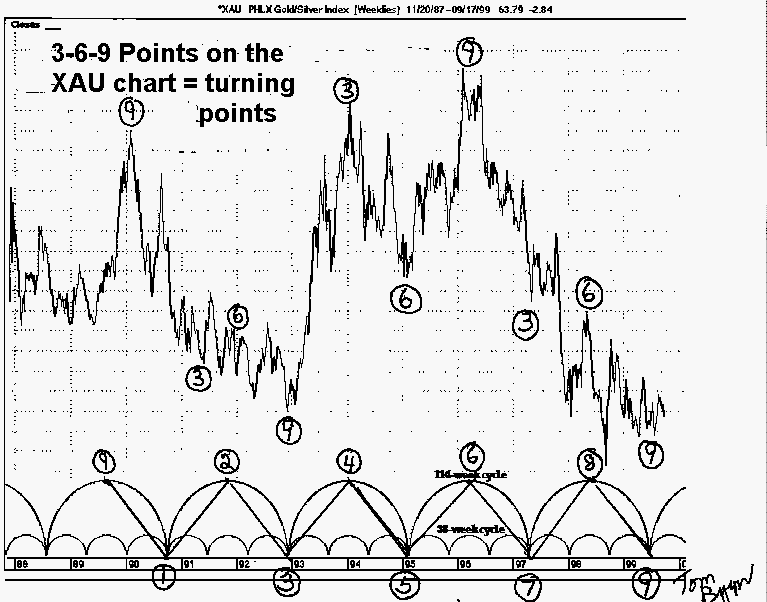
Byron's major work has been in the Philly XAU Gold And Silver Index. The XAU chart above shows the monthly cycles. The current "114" chart shows the nine wave structure structure in the weekly chart of XAU. the numerical labels are for the 114 week cycle and the 3-6-9 price correspondences.
You will note that nine 57 week half cycles have ended. Eighteen of these (or nine whole cycles) takes us back to thje 1980 highs. Thus we may in fact be at a long term low as subseaauaent action has strongly suggested.The "114-9" chart shows the smaller 38 week cycle counts and this cycle's price correspondences.
31 October 1999
Topm Byron's SPX "Nines Indicator" confirm that his standard nine wave move from July 1998 was completed at the recent lows. This implies we will have nine waves alternating up and then down but in a upward trend direction over the next approximately 15 months. This then is the up phase cycle. The last up phase cycle lasted from ~ 14 April 1997 to 20 July 1998.
The SPX chart, not updated, shows these prior cycles.
In a message to me yesterday, Byron had these comments on the XAU Index and Gold:
"Yesterday, the weekly XAU index finished it's 19th week up from the ending of the last 38 weeks XAU cycle (6/18/99)...right now things don't look so good for the gold and gold shares market. The XAU top out at I believe the 15th week and now with the ending of the up part of the XAU 38 weeks cycle upon us, we will be experiencing 19 weeks of downward pressure (TIMEWISE).
So I plan to stay away from the gold market for now. As I previously mentioned to you......, I have alway been unhappy with the fact that the XAU never did put in its 9th wave down from the beginning of the bear in 1996 on its PRICE bar chart.
So now with 19 more weeks of downward pressure on us, I really would not be too unhappy if it gave me that 9th move down now on its price.
Not saying that it will happen, but I'll take it if it comes my way...London gold, the futures contract and individual gold companies have already put in their 9th's down."
24 December 1999........Why Nines (Or Rather 3 x's 3)?

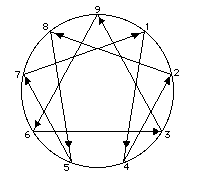
In the early part of the 1990's I ran across a book titled "Personality Types - Using The Enneagram For Self-Discovery" written by Don Richard Riso in 1987 and published by Houghton Mifflin Company of Boston, Massachusetts. Later this book was revised in 1996 by Don Riso with the help of his co-author, Russ Hudson.
The back cover of the 1996 edition of "Personality Types" reads in part as follows:
"Personality Types has become the indispensable resource in the field of Enneagram studies, as well as a cherished classic in the literature of personal growth around the world. This second edition is not only a monumental intellectual achievement representing the culmination of more than twenty years of work, it is a landmark in the history of psychology and human understanding.
For the first time, the landscape of human personality has been completely mapped out - from the high function state of ego transcendence to the depths of pathology. Unequalled in the Enneagram field, the authors provide precise and comprehensive systematic descriptions of each personality type, as well as new, expanded descriptions of each type's two major subtypes and its Direction of Integration and Disintegration."
During my reading of the first edition, I spent approximately 10 months in deep study and involvement with the written material in this book. I found it to be of great interest and it's accurate description of the traits of my particular personality type to be right on target in many ways.
Shortly after moving to my current residence in late April, 1995, I soon discovered that the new public library across the street had several internet computers including 2 with the Netscape browser set up which permitted viewing of historical charts of the financial markets.Almost immediately, I found myself looking for nine waves in the financial markets.
What triggered my looking for nine waves at that time I believe was the following:
1)Under the section "Analyzing The Enneagram, page 445 of the 2nd edition, the authors state the following:"Even though we will give several explanations of the Enneagram, it seems that, in the final analysis, there is no single theoretical explanation why the Enneagram works as it does. No one underlying theory is the sole basis for the Enneagram.... This in itself suggest that the Enneagram is a universal psychological symbol, one which can accommodate many different interpretations while retaining its unique charter."
It was this reading of the possiblity of "many different interpretations", that gave me the idea that beside only a psychological interpretation of the Enneagram, that I might find something in the way of an Enneagram Nine in the financial market place.
2)And finally, under "The Dialectical Approach" I quote the following:
"The reason there are nine personality types in the Enneagram is that its structure is the result of a three-times-three arrangement, or two dialectically related groups of three. No matter which level of analysis we may wish to take toward the Enneagram, we find that the dialectically related factors produce nine distinct personality categories.
If there is a single explanation of why the Enneagram works as it does, and why it is such a comprehensive system, it is because the Enneagram is a dialectical system, and as such it can be used to analyze different aspect of human nature dialectically. On this, the most basic level of analysis--one which has been seen in the Guidelines and throughout the descriptions--the Enneagram can be thought of as an arrangement of three Triads containing three different personality types. Each Triad, is a dialectic of the problem of that Triad.....
When we consider dialectic patterns (thesis, antithesis, and synthesis), we are always considering interrelated groups of three....it seems that the dialectic patterns reflect something in the patterns of the mind itself. If there is a single reason why the Enneagram works, this is it."
The sentence "it seems that the dialectic patterns reflect something in the patterns of the mind itself", peaked my interest enough to attempt to understand what these "patterns of the mind" might be all about.
At the start, back in mid-1995, I was looking for 9 waves only. It was only later, with the passage of time, that I became aware of the possibility of integrating the waves with cycles (38 and later 114 weeks cycles). And only much later, in May, 1998, that I first saw the 3 x 3's arrangements within the cycles and waves.
Most of my exploration of the above involved work with the XAU weekly and monthly indexes. Later, I started working with the financial weekly indexes also, especially the SPX weekly with it's slow stochastics technical indicator.
From my understanding,in the Enneagram symbol of "Personality Types", it is the "three" groupings of "three" personality types that produce the circle of the Enneagram symbol. For further information about this, please see the book or you may also want to explore more about the Enneagram at Don Richard Riso and Russ Hudson web site at http://www.enneagraminstitute.com/ At the site, you can link up to other Enneagram sites via the Enneagram WebRing of Enneagram Related Sites.

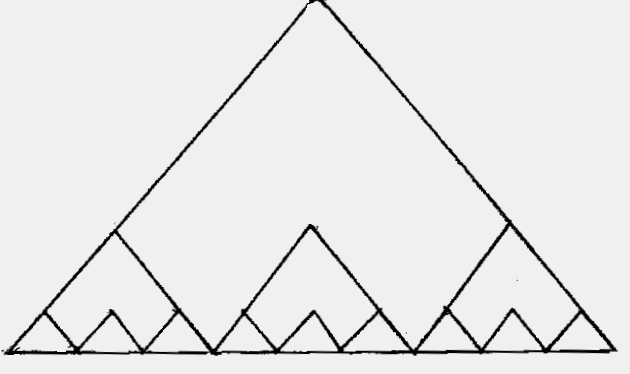
On the XAU weekly charts, I have shown that "three" sets of 38 weeks cycle make up the larger 114 weeks cycle and it is then "three" 114 weeks cycles that produce the larger long term cycle which began the bull move in gold and gold share in December, 1992 and which peaked in early 1996 and now, I believe, ended it's bear market phase in June, 1999.
For further clarification, please see my XAU weekly and monthly charts that Tom Drake has posted previously on this web page.
So we have three sets of three (3 x's 3) 38 weeks XAU weekly cycles (or "nine" 38 weeks cycles)which forms the base of the full bull and bear move in the XAU index from December, 1992 to June, 1999.
This creates three 114 weeks cycles which produces the full larger cycles as explained above. And, thus, like the the circle of the Enneagram being produced by a three x's three arrangement, we have the longer, full term cycle created by a 3 x's 3 arrangement of 38 and 114 weeks cycles.

Finally, as an aside, I quoted "Personality Types" discussion of "a dialectical arrangement of groups of three". Having not read or study anything about the subject of "dialectics", and I believe that Mr. Hegel and Mr Marx had something to say on the subject, the thought did pass through my mind that it would be quite something if a dialectical arrangement showed up in the symbol of our capitalistic system, the stocks markets, and that was in the form of a three x's three arrangement in the financial stock market indexes.
I have not yet done as much work on the financial indexes as I have on the XAU weekly and monthly charts but this dialectic possibility was just something that I thought that I would mention at this time.
There are many more aspects to the nines than what I have discussed above, but I think that I will end here. Hope that the above has been found informative and of interest.
Tom Byron
@Byron's Nines
14 February 2000:
"Tom:
We have a nice matchup with the May 1999 weekly high (in Newmont Mining)and 38 weeks later a nice low in the last week of January 2000. Also a 1-9 (count)fits nicely from the slow stochastic..."

(Also)"if 7/20/98 was an important top TIMEWISE, then the downward pressure of the largeest triangle should, at some point, take hold--late 1995 to early 2002 cycle. It looks as though we began #5 of the 38 week cycle on 1/1/2000 as I have numbered....but un til we take out the previous lows of October 1999 and maybe even 1998, this placement of the nines on the weekly S&P chart ain't proven!"
Tom Byron
@Byron's Nines

BYRON'S NINES UPDATE, 28 JULY 2000, THE SPX
#1 chart shows the up and down 9 wave movements within the 57 weeks cycles on the slow stochastics technical indicators at the bottom of the chart. Note that TIMEWISE, the current 9 wave movement is scheduled to end on Friday, November 17, 2000.
#2 chart has the longer term 9 wave which I have beginning in November, 1994. (this starting date of 11/94 has yet to be proven)
Note that I have marked a 9th for the July, 1998 top which shows up on the price bar chart and the slow stochastics indicator.
Also note that my favorite turn indicators, the 3-6-9 counts of the waves, are placed/end up on each of the 57 weeks TIME periods. The turns being the beginning of a new up or downward 9 count movement within each 57 week period. See chart #3.
#3 chart has an additional technical indicator the Relative Strength Index with a 9 count from the July, 1998 high. As can be seen there is currently a channel in place from from the mid-year high in 1997 to now. the RSI has been bouncing off the walls of this channel espeically since the ending of the last 57 weeks - 9 waver on 10/16/99.
Will be interesting to see if the rsi continues to run within the channel until/or near the 11/17/00 date when the current 57 weeks cycle will end. I have no way of knowing if it will do that..but a breakout from this 2-3 years channel will also be interesting.
As mentioned above, this #3 chart shows the 9 wave count within each 57 weeks period. The 1-2-3 up and the 1-2-3 down within each 38 weeks cycle (the triagnles) seem to be marching in step with the slow stochastics indicator recently.
Hope the above is of interest.
Tom Byron
BYRON'S NINES UPDATE, 17 September 2000
Tom has written to point out the possible nine wave up pattern completion for the CRB Index. He also points out that this week's high was within a whisker of being a 61.8% retracement of the 1996-1999 bear move.
CRB Waves
Note also the unusual divergence of the CRB Index and the XAU gold stock index.